Transmissio

A program to visualize temporal graph data (network) combined with geographic information (node coordinates). It provides a straightforward tool for representing network data in an interactive way, in the form of static or dynamic visualization.

In addition to being an open-source project, this program has been designed using Processing to be easily and highly customizable. In this page you should find all the informations needed to download, install and use the program.

Sources of the program are available through a Git repository on GitLab: https://gitlab.com/gaelbn/transmissio. You can download or clone the project using this link.
Pre-compiled executables are no longer provided as it was too time-consuming to maintain and without any performance guarantee.

Note that pre-compiled executables were previously provided, but not likely to work properly, so, only the way consisting to run the program directly in Processing is now available, and only need two steps:

First step is to install Processing (version 3.5.4 or later recommended). You can download it from the Processing website.

Then, download the sources by cloning the git repository or by downloading the archive containing the files: https://gitlab.com/gaelbn/transmissio.

The data must be provided as two separate files in csv format, corresponding to the edge list and node coordinates. A third file containing the visual parameters can be provided in order to customize the appearance of the visualization. Optionally, a file containing the geographical features of the study area can be provided in order to obtain a rendering of the boundaries of the area.

A multi-line adjacency list format is used for graphs representation. File must contains at least four columns: source_id, destination_id, date and weight, whose order must be respected. First and second columns correspond, respectively to the source and destination nodes, third column contains temporal information (date or time-step), and the fourth column contains the edge’s weight. Take care that there is no way of representing isolated nodes unless the node has a self-loop edge. The default name for this file is network.csv, but you can choose the name you want and specify it in the configuration file.
The dates will be automatically converted into time-steps to save computation time. Five temporal scale conversion are already implemented: year, month, week number (week_num), period of seven days (seven_days) and day. You can also implement your own.
It is required to provide the dates in format ISO 8601, in the extended format. Calendar date representations are in the form ‘YYYY-MM-DD’, where [YYYY] indicates a four-digit year, 0000 through 9999. [MM] indicates a two-digit month of the year, 01 through 12. [DD] indicates a two-digit day of that month, 01 through 31. For example, ‘8 May 2019’ have to be represented as ‘2019-05-08’. You can also directly provide time-step instead of date and indicate it in the configuration file (temporal_scale, timestep), assuming you did the conversion by yourself.
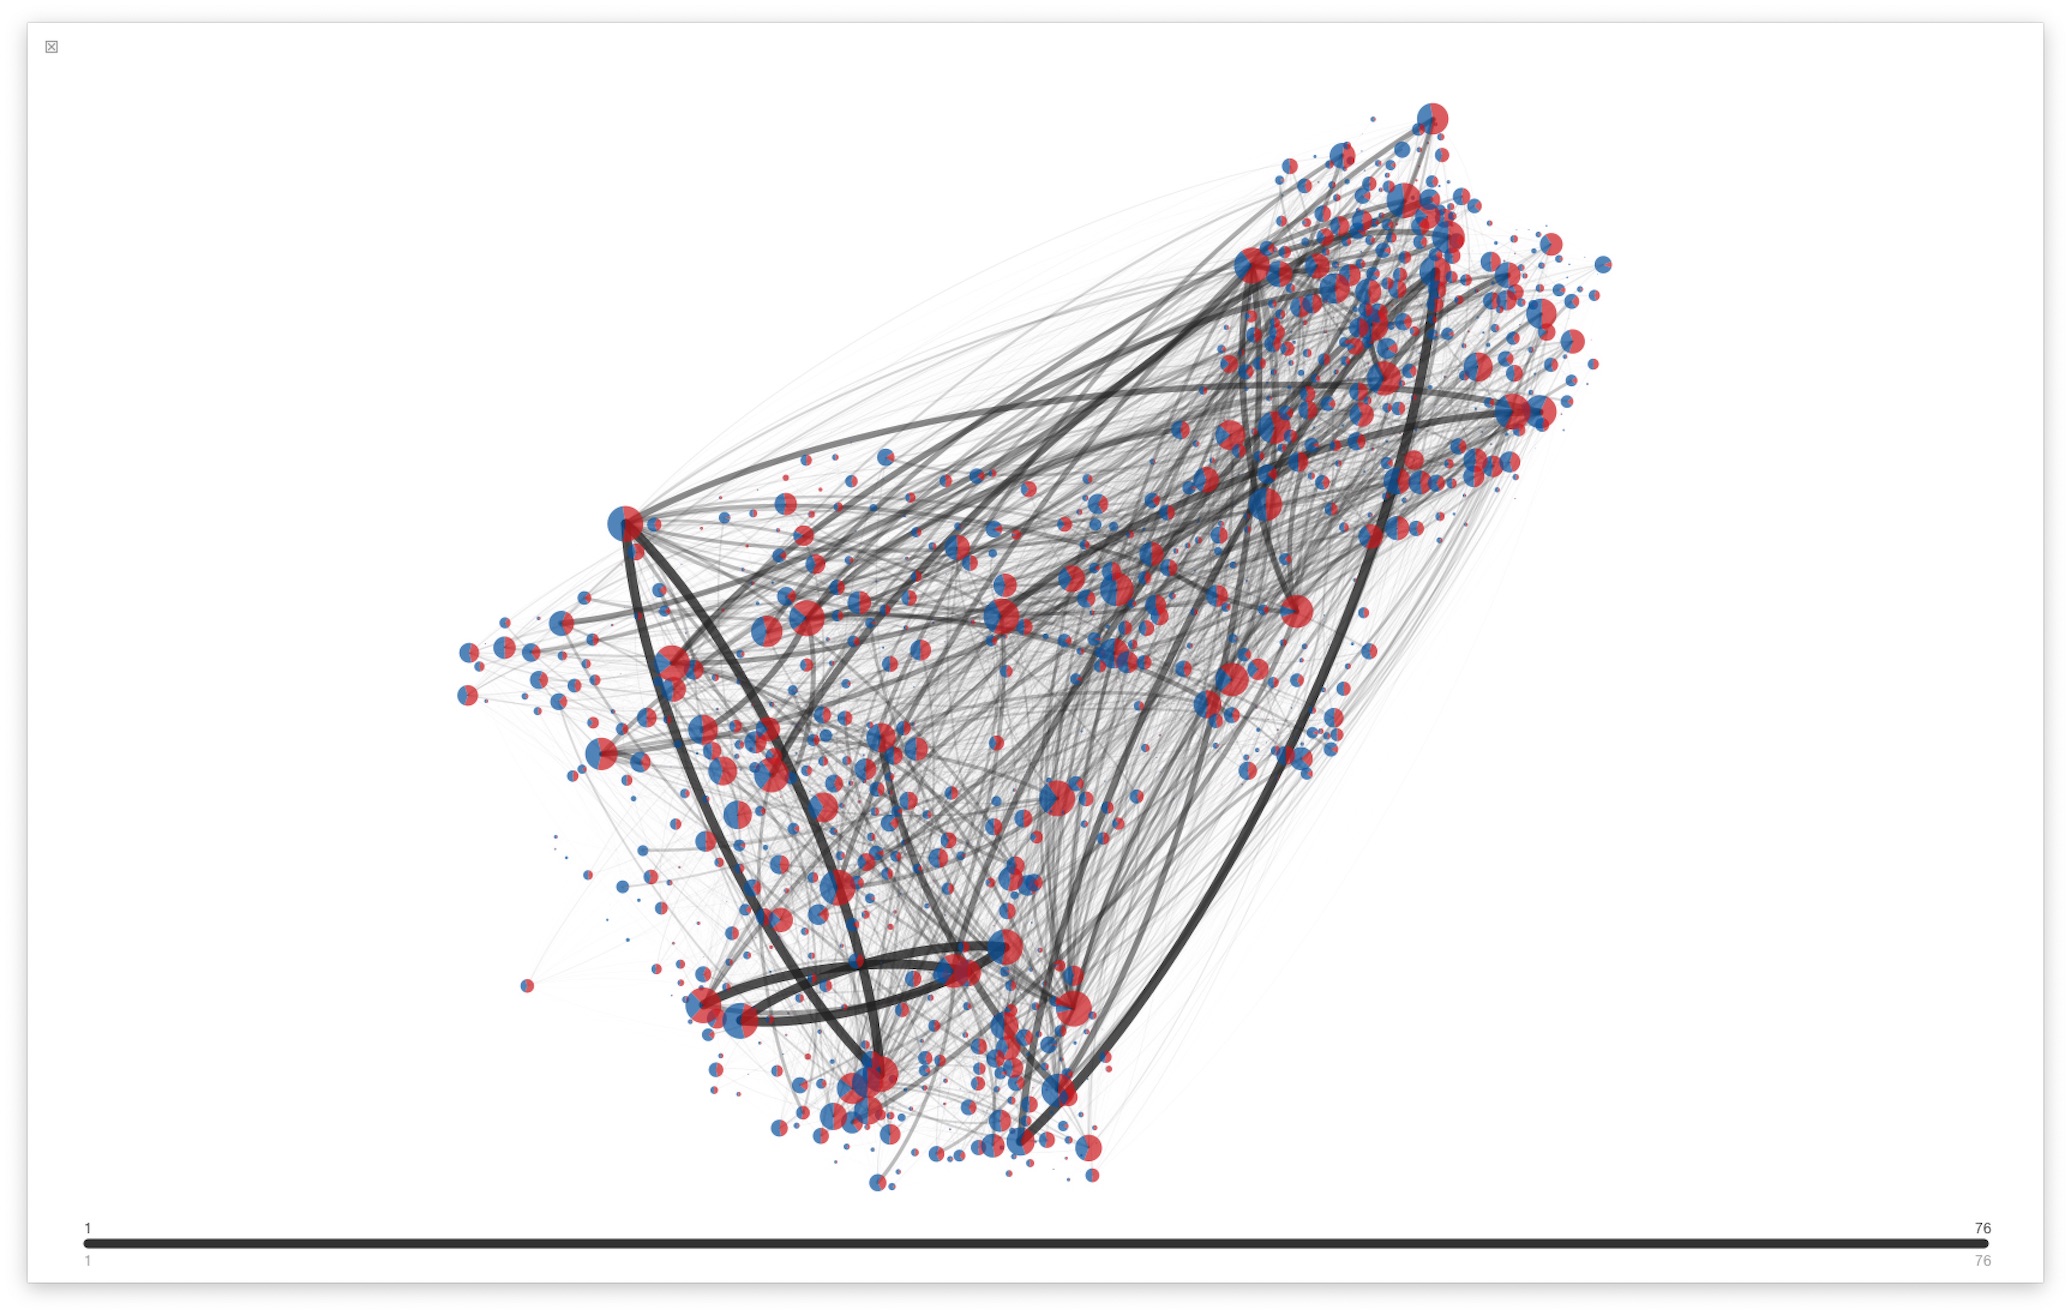
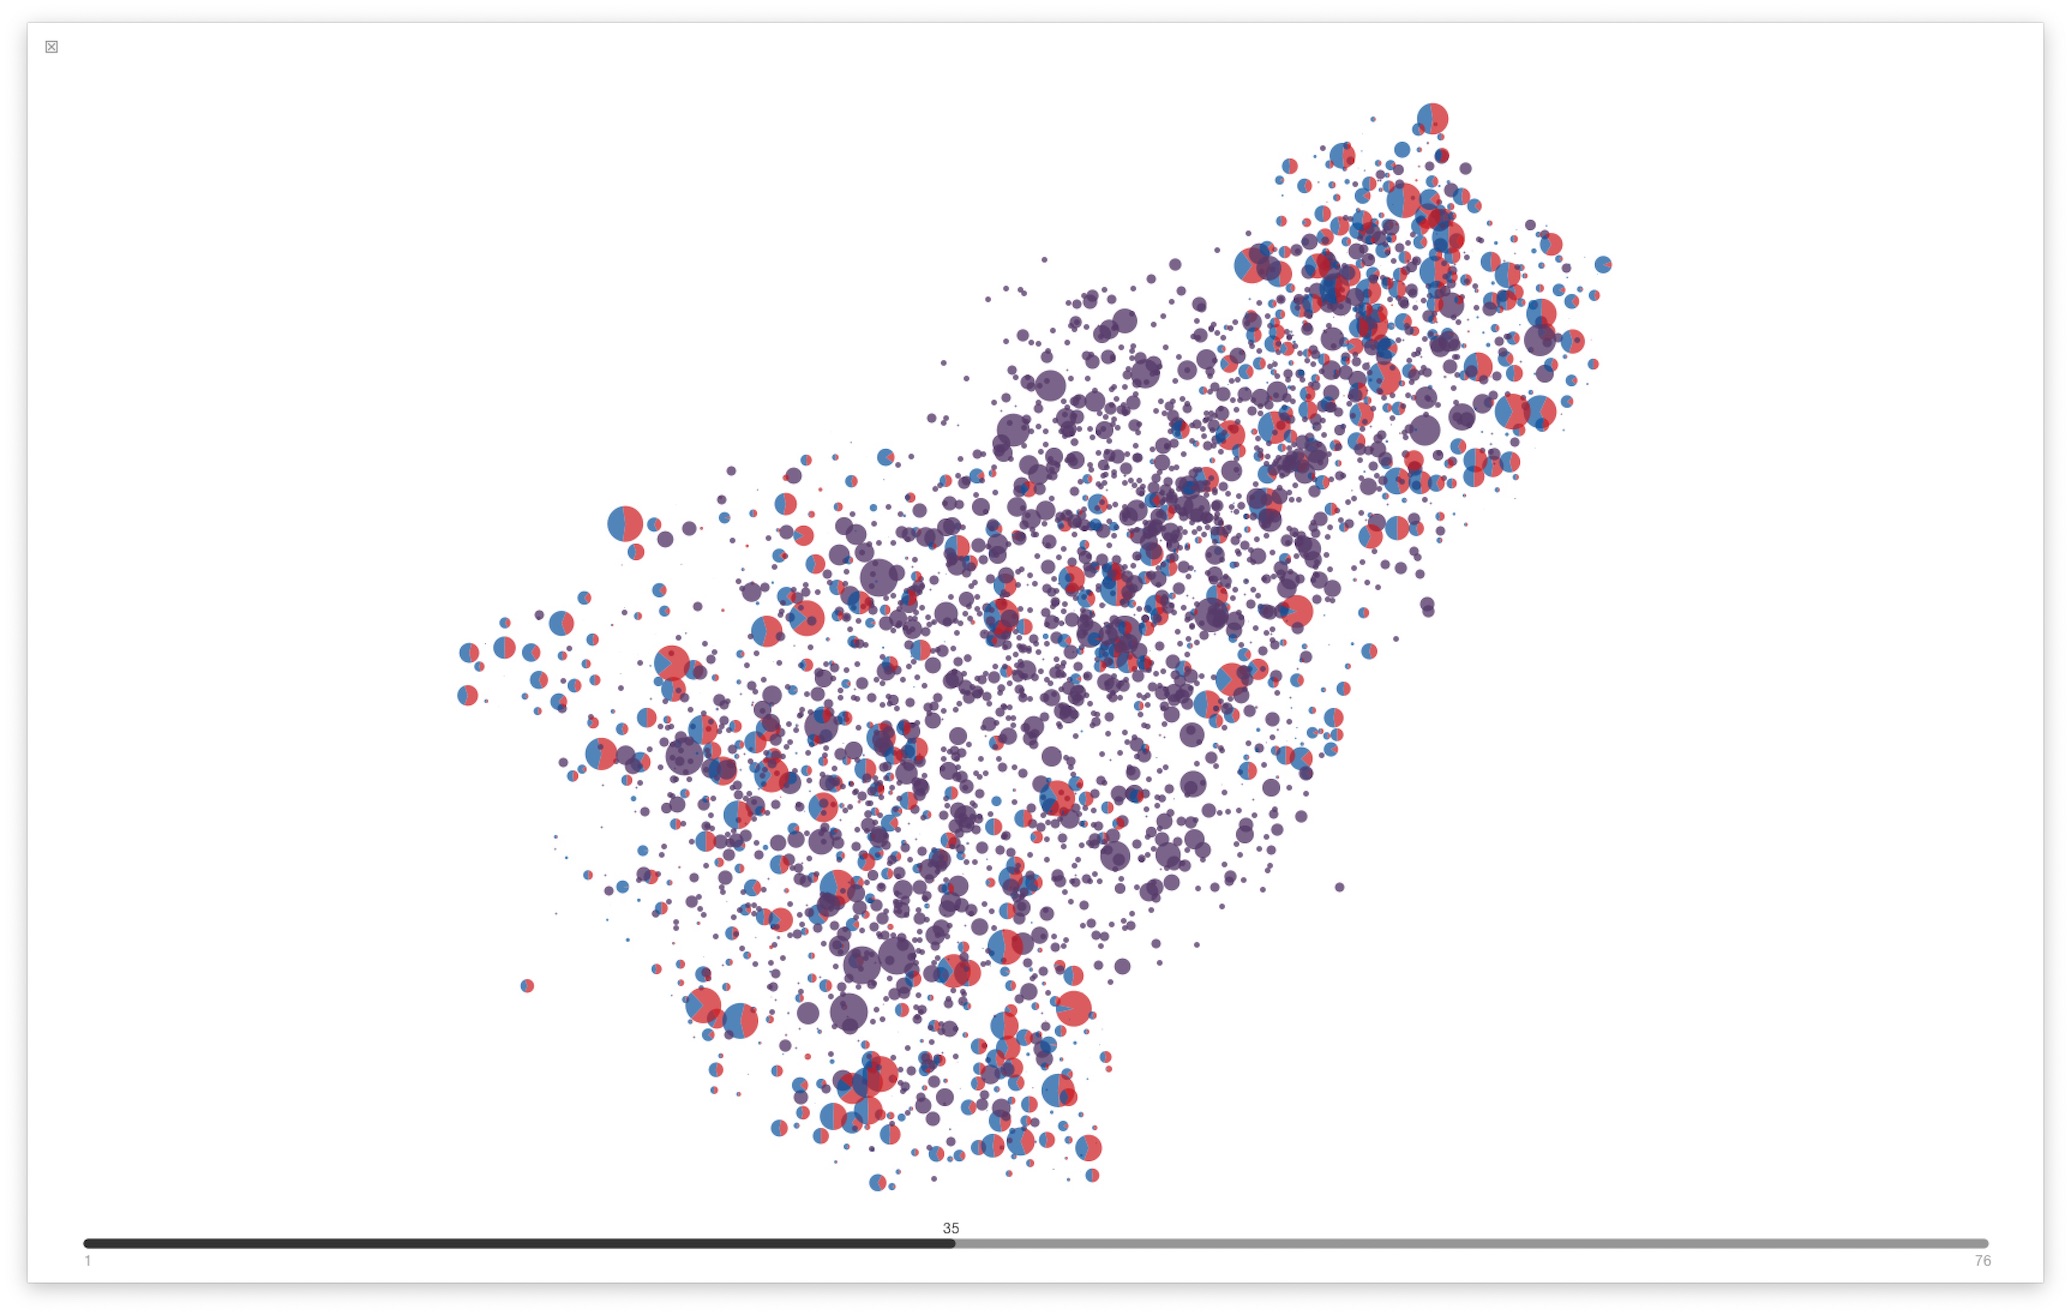
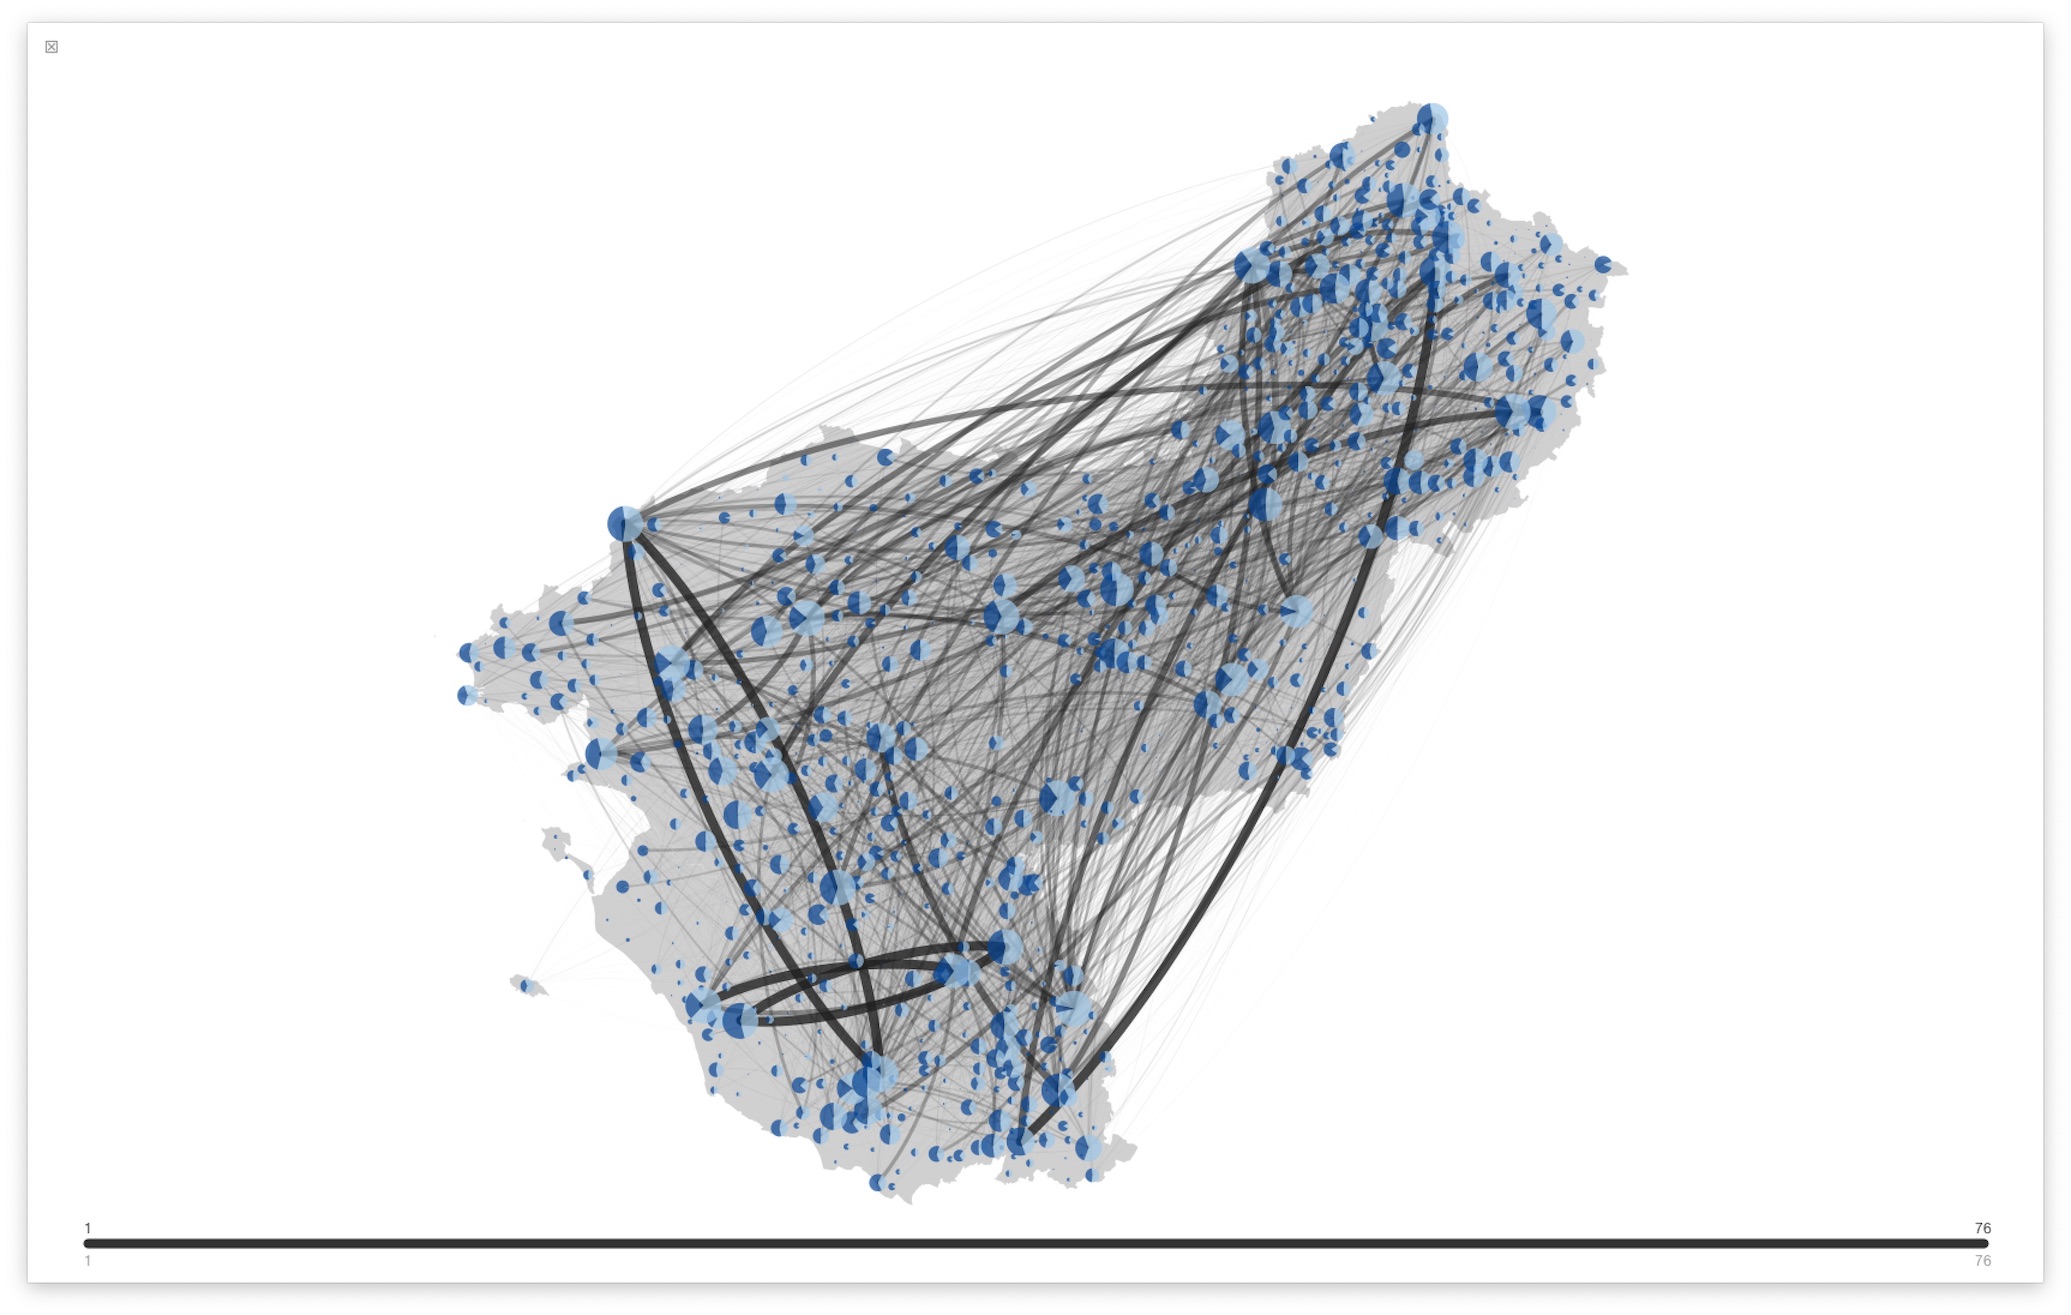
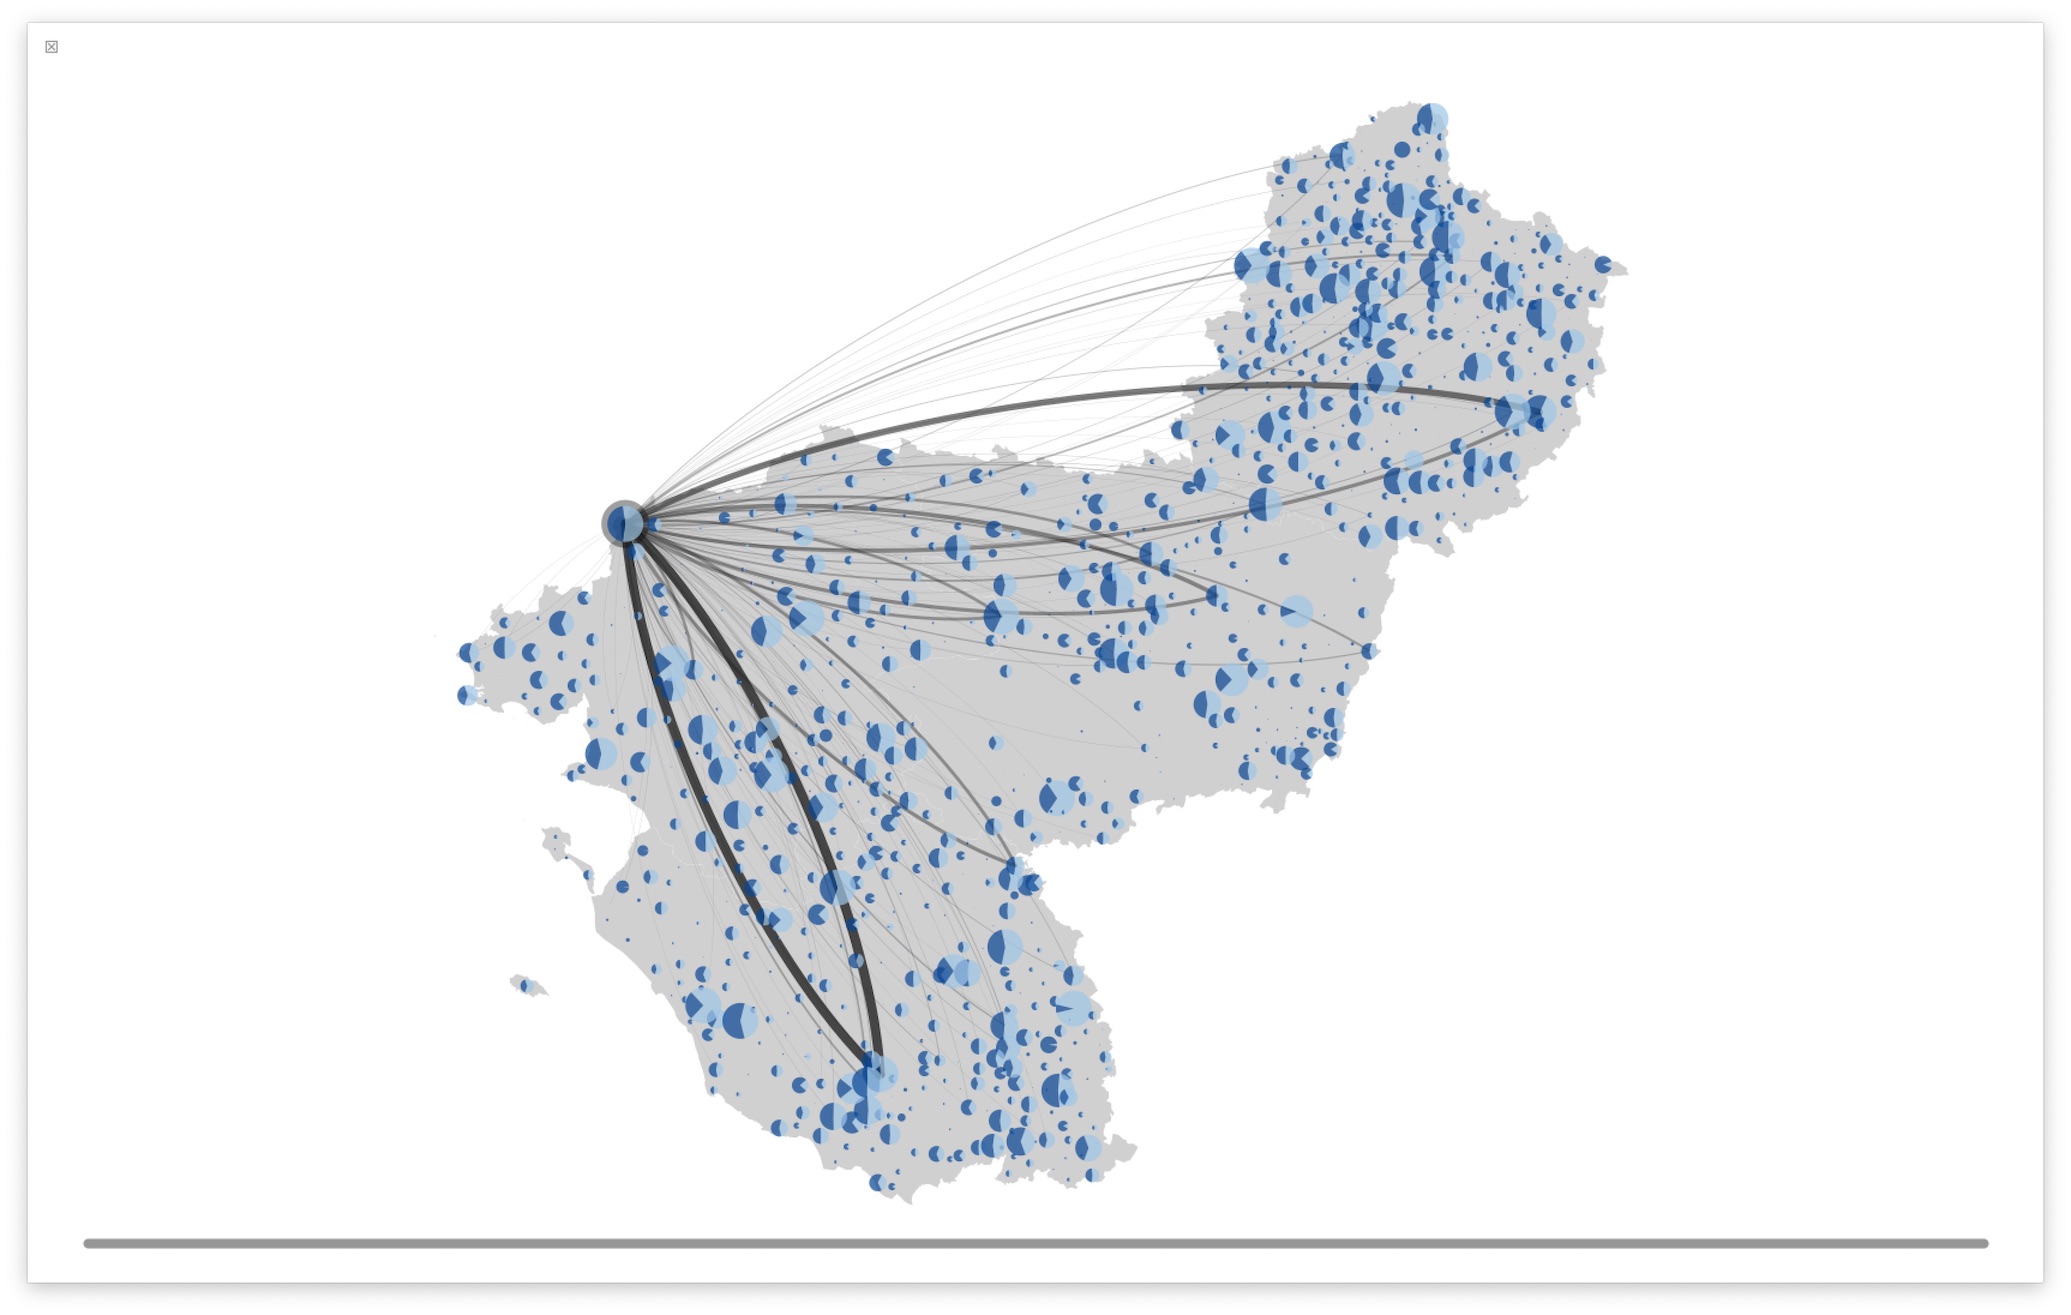
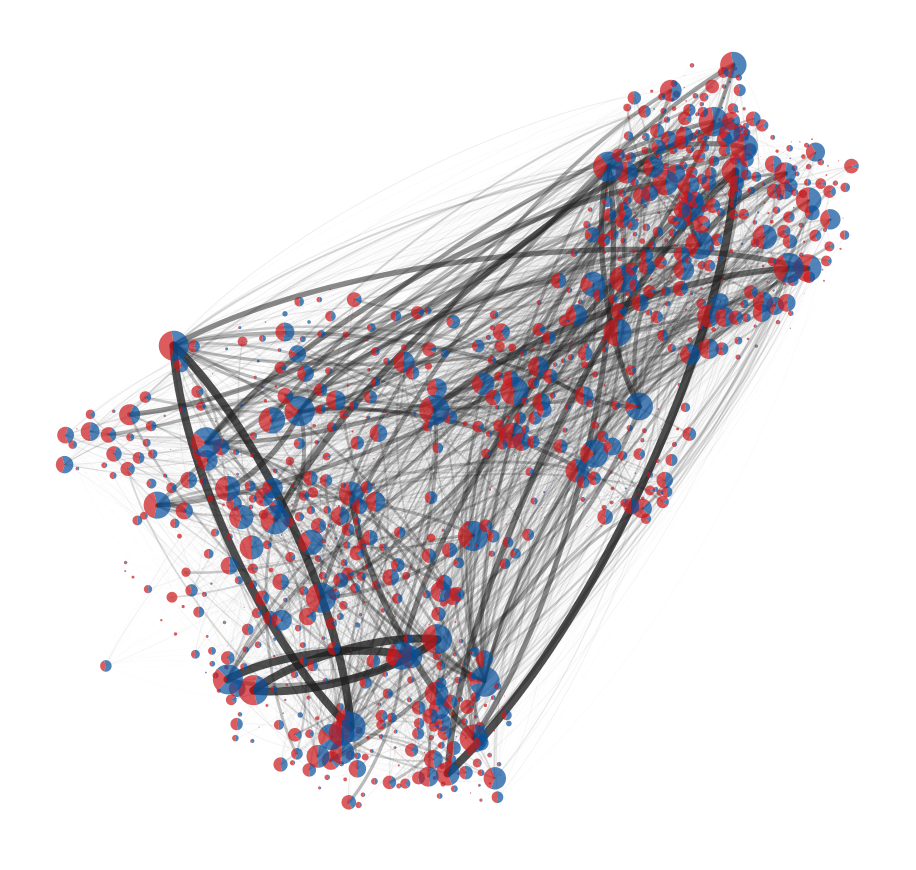
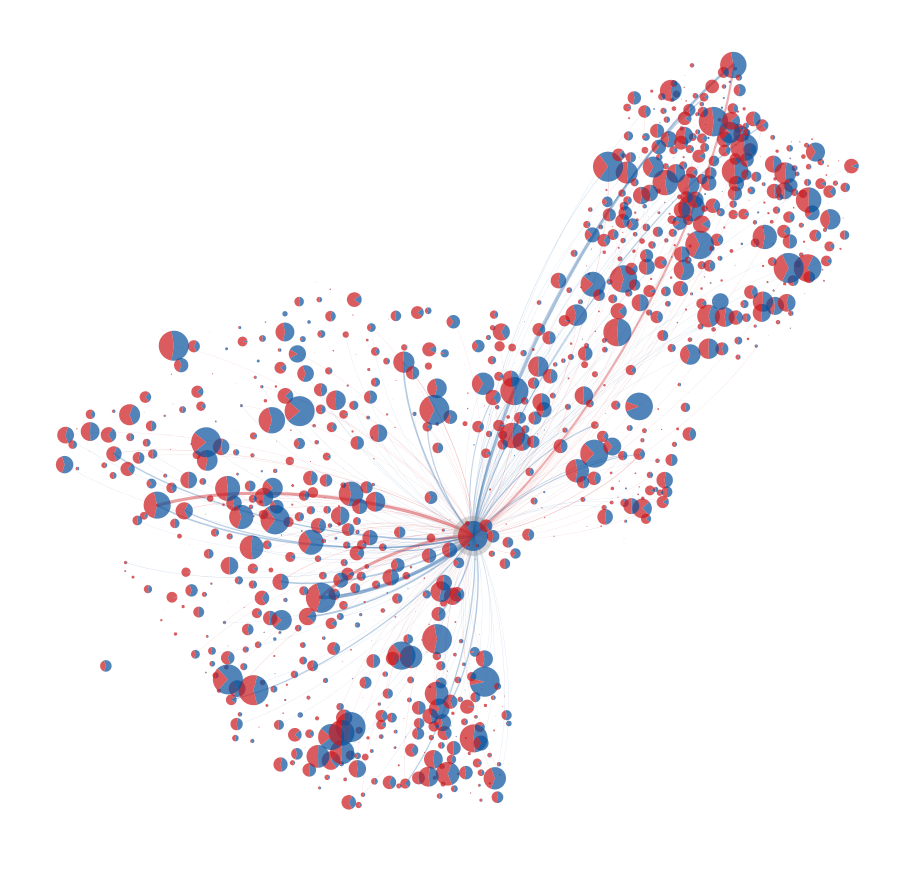
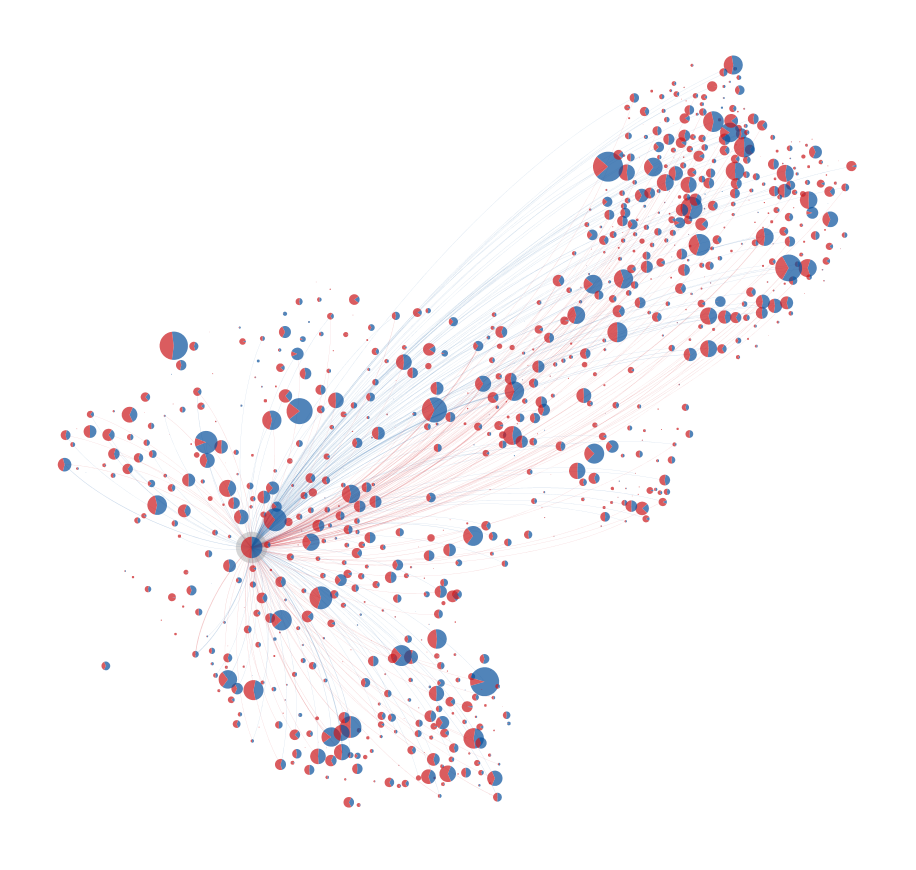
Optional additional columns can be added and used to describe the type of flow. It is thus possible to colorize the edges according to the tags used in one of these columns. The index of the column to be used, the tags and the colors associated with each tag must then be specified in the configuration file. As a reminder, the first column has the index 0, so the column used to describe the type of flow will have an index equal to or greater than 4 (column in position 5 or higher).

A csv file giving the node id, longitude/X-pos and latitude/Y-pos of the nodes in the network. File must contains the three columns: node_id, coord_longitude, coord_latitude, whose names must be respected. The default name for this file is coord.csv, but you can choose the name you want and specify it in the configuration file.
The type of coordinates (gps by default or projection) can be specified using the parameter coordinates_format in the configuration file. If the nodes coordinates are provided in WGS84/GPS format (in decimal degrees ‘DD’), the equirectangular projection (or equidistant cylindrical projection) is used as map projection, based on the center of the area to draw, in order to obtain cartesian coordinates. If you have data in another format or if you want to use another map projection, you will need to implement it. If coordinates are already provided as a projection (use the parameter coordinates_format with the argument projection), they will be used as provided and simply rescaled to fit to the drawing area.

A JSON file named viz_properties.json (name of this file must be respected). An example with all the parameters that can be adjusted is given in the main project folder.
The parameter temporal_scale can be one of the following : year / month / week_num / seven_days / day / timestep (this last one corresponding to no conversion, assuming the data is given in a time-step scale).
Colors have to be given in hexadecimal notation, for example: blue 08519C, red CB181D, orange D94801, green 238B45, purple 54278F, grey 777777, black 000000, white FFFFFF.

A geoJSON file of the corresponding area. Area and/or boundaries are drawn by looping on the geographical features contained in the provided file (parameter boundaries_geojson_file in the configuration file). Only geometry of type Polygon or MultiPolygon are considered. Coordinates have to be in the same format as the ones in the node coordinates file.

At launching (using the Run button from the Processing app), the program will ask you to choose a folder containing the files: the edge list, the node coordinates, the configuration file, and the geoJSON boundaries area. Only the first two files are mandatory, the default settings will be used if the configuration file is not provided (which will probably not be appropriate for a proper rendering).

Shortcuts are not case sensitive, and can be used both in lowercase or uppercase:
O – select / change the data folder
Q – quit
N – display / hide nodes
E – display / hide edges
P – save the current visualization as PNG file
C – activate/desactivate image cropping (PNG file only)
V – save the current visualization as PDF file
R – reload the visualization properties and refresh (re-draw) the displayed graph
D – start/stop the dynamic visualization
S – activate/desactivate the record of dynamic viz (as frame images), see the processing documentation on how to make a video from this set of images using the Movie Maker tool (from the Processing app: Tools menu > Movie Maker). See this video for more informations.
A – switch between lines and arrows for the representation of edges
L – display / hide the legend informations

Here are some examples of visualizations produced using the program.

This program was designed using Processing in order to be easily and highly customizable. In particular, you might be interested in revising the nodes appearance (see the function drawTheNode in the node.pde file), the links appearance (see functions drawCurvedLine and drawCurvedArrow and the code in the networkDrawing.pde file), and legend design (see the legend.pde file).

It is always welcome when people include a “Built with Transmissio” note with a link to this page or the git repository, because it helps to create interest and attract more people to the project. It is not/can’t be required, but very much appreciated because this is an open-source project and it is a way for you to help in return.

This software is governed by the CeCILL-B license under French law and abiding by the rules of distribution of free software. You can use, modify and/or redistribute the software under the terms of the CeCILL-B license as circulated by CEA, CNRS and INRIA at the following URL http://www.cecill.info.

If you have any comments or questions, just send an email to [email protected], every effort will be made to answer it as soon as possible.

Having a problem? Hopefully the information in this section will help. If, unfortunately, this section does not contained your issue, do not hesitate to get in touch using the email provided in the contact section.

Take care that there is no way of representing isolated nodes unless the node has a self-loop edge. In the future, an option will be available to render isolated nodes.

Maybe provided coordinates are not WGS84/GPS, in decimal degrees ‘DD’, which is the default coordinates format. Try to change the argument of the parameter coordinates_format by using projection in the configuration file, and see section ‘3.2 – Node coordinates’ for data requirements.